How I met dashDB
Good morning my friends! It is cold this time here in Ireland, so I thought about remembering a warmer time, like last month in Las Vegas for the Insight 2014 conference!
I was lucky to attend this conference (and fly over to Las Vegas) and this was a great time and a great opportunity to learn about new products while at the same time getting to meet a lot of interesting people.
During the week, I had to present a Lab Session I prepared about databases…datawarehouses…on cloud…on Bluemix…
Situation
Wait a moment. Cloud? Datawarehouse? Analytics? This sounds cool! Well, honestly, it is.
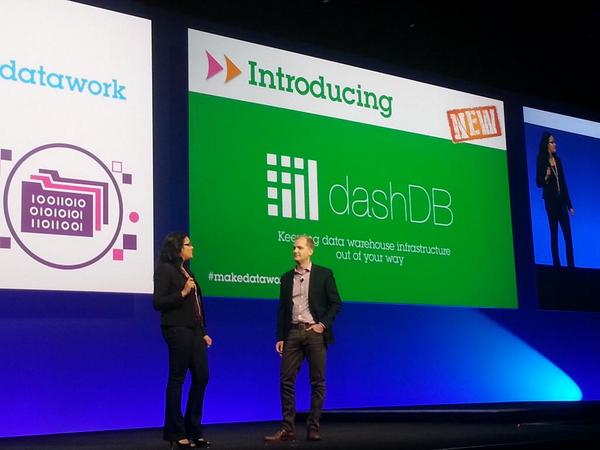
During the IM general session, there was an announcement about a new product in the datawarehouse world, aiming to meet the needs of customers willing to have an hybrid approach for their Analytics. After the general session, the name of the product I was doing the presentation about was out there: dashDB!
What is dashDB?
Probably some of you may have heard about dashDB and asked yourself: what is this exactly? I will try to help.
Now more than ever Data is an extremely important resource. It is not just about the data, but mostly what you can do with this data, what you can learn from it, what you can visualize from it.
One of the ideas of dashDB is to offer the flexibility of the Cloud for a solution to just load and work with our data and visualize and extract the most meaningful insights for our business, for our case.
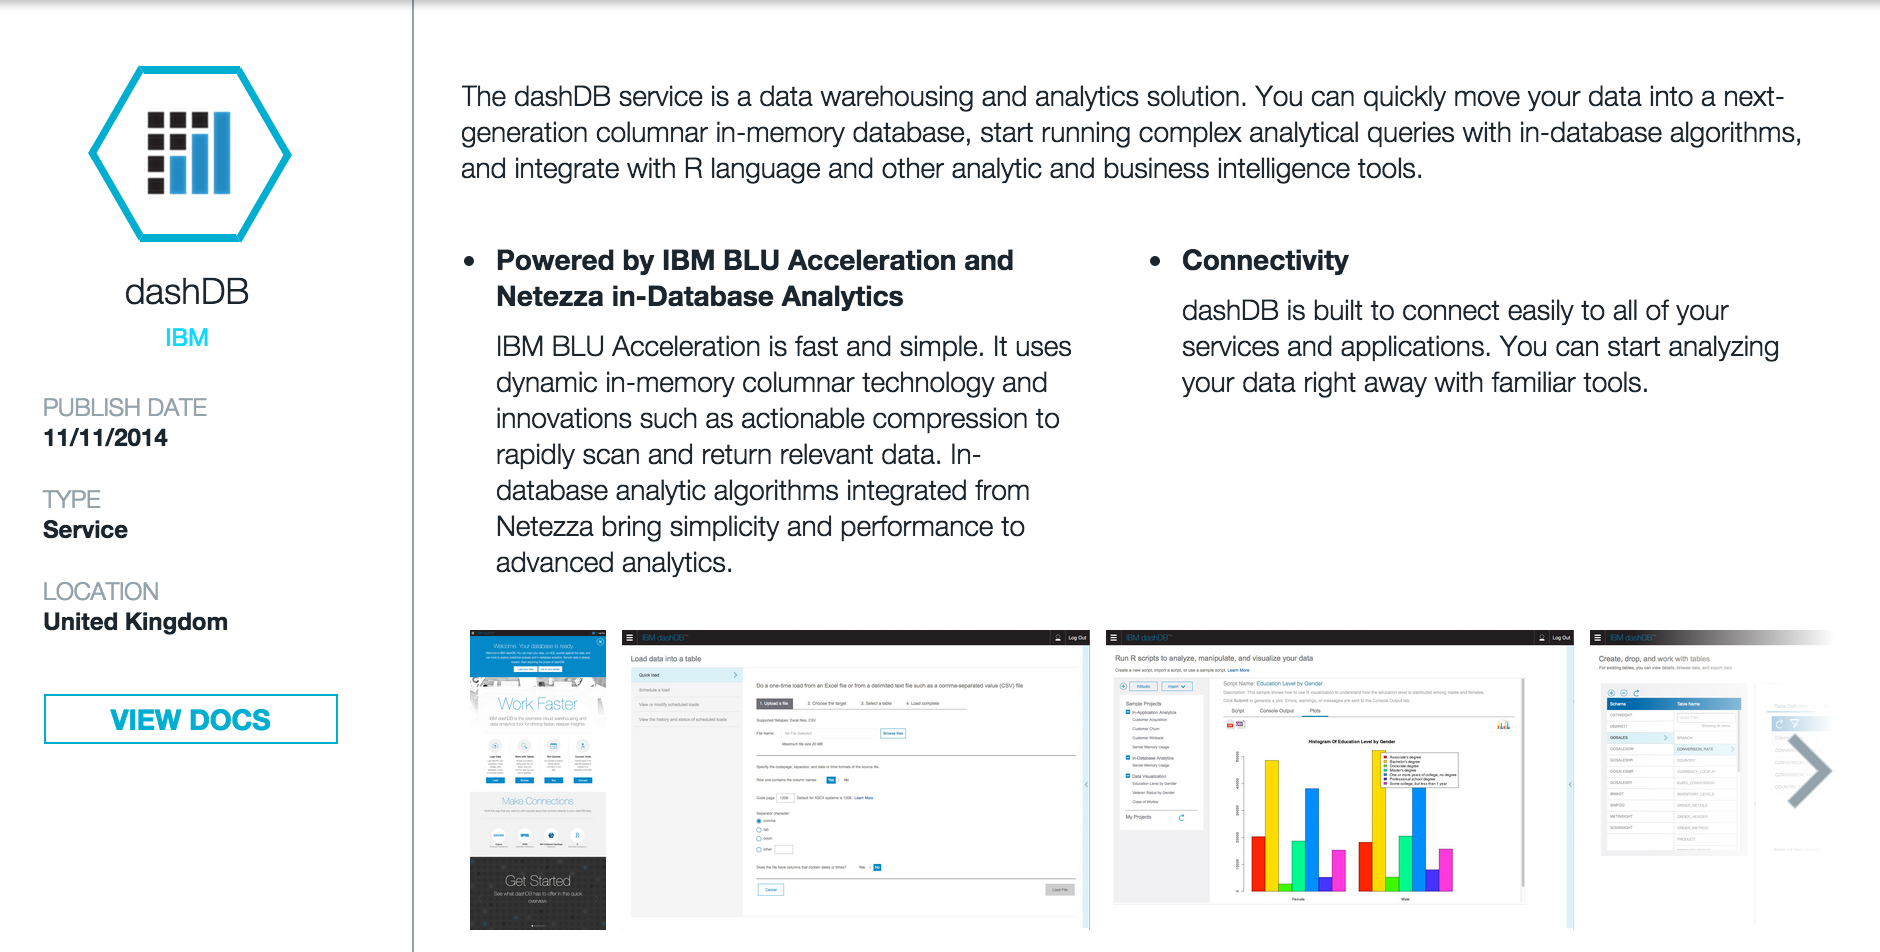
dashDB offers the ease of use with simple menus where we can load our data, query it and work with it, with some other features that make it a great product. The technology behind it is using in-database analytics processing combined with in-memory columnar database technology that can speed up massively your analytic workloads.
Going to a lower level, dashDB runs on top of Softlater, and you can actually use and try dashDB from BlueMix and use it as a building block for your application. But it can also be used on its own to speed up your analytic processing by using the service on the Cloud.
Remember, this is not just about going to the Cloud and moving everything there. This is about hybrid Cloud and giving YOU the possibility to chose the best approach for your application or your business. You may already have your datawarehouse on premises, but just imagine how useful could be to rapidly deploy and use a service like this and not having to wait to get the infrastructure ready…
Who is this for?
When a new product or new service comes to the market, one of the frequent questions is who is this for or who can benefit from this. dashDB has been developed with different user cases in mind and for this it can suit different needs and it will be evolving and adding more useful features.
- IT professionals
It can be useful when they need to build a solution without worrying about the underlaying infrastructure. Servers, OS, patches, you name it, you can just deploy and use with dashDB.
- Business analysts
The idea of dashDB is to offer something easy to use, where users with little experience could load and get useful insights from their data without waiting for DBAs or for other departments for a report. Just go and get the insight you need from your data.
- Application developers, idea creators
With dashDB, an user willing to build a new application using smart analytics on a particular set of data, can just load or merge data from different sources and extract the right data analysis he needs. This can also be used as service for your application running on Bluemix so your queries and analytic processing will definitely benefit from this. And you can also just synchronize data coming from a NoSQL database used in your application. This can be really useful if you think of mobile apps, systems of engagement or things like Internet of Things data stored in a NoSQL database!
- Data Scientists
Load and get insights from your data. This is something always useful but then what? With dashDB, users have R capabilities ready to use out of the box. Integrated RStudio environment and R runtime will be of a great help for data scientists willing to apply statistical analysis or visualize their data.
My favourites
From my experience using dashDB, I already have some favourites features that in my opinion are key for dashDB:
- Data synchronization with Cloudant
- R runtime environment ready to use
Data synchronization with Cloudant
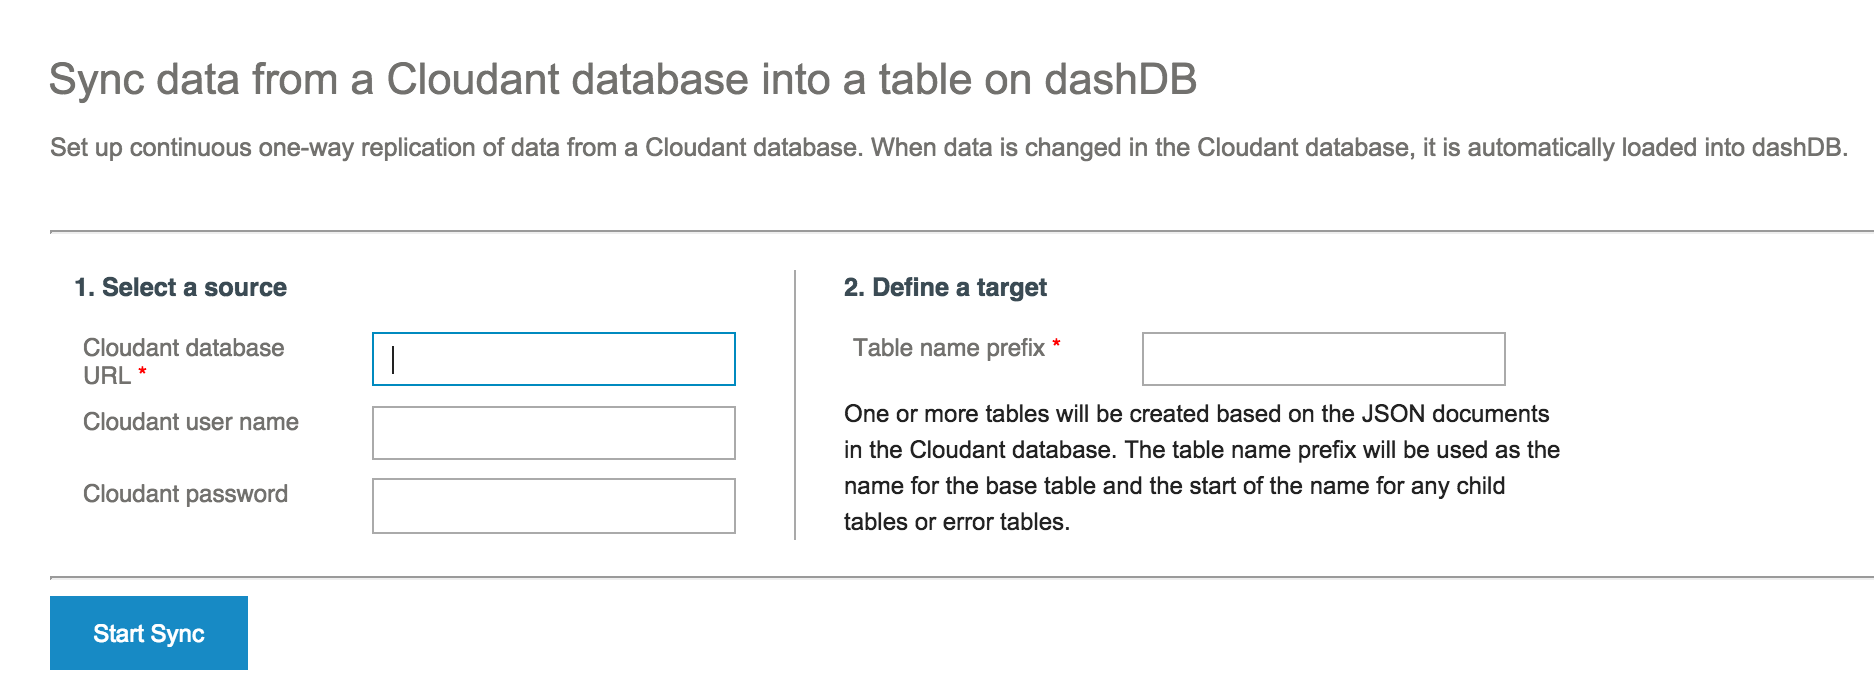
dashDB offers data synchronization from Cloudant (available from dashDB on Bluemix and on cloudant.com). This will seamlessly discover the JSON documents in our Cloudant database and automatically create the table structures to store the data coming from Cloudant. This might sound complicate, but it is all easily done in 3 or 4 mouse clicks, try it!
Once the tables are created, the data will start to be synchronized automatically and more important, this will be a continuous feed into you datawarehouse.
R runtime environment ready to use
The included R capabilities can be really useful to get useful insights from the data we have. And thanks to the R library for dashDB, we can benefit from in-database analytics functions that would not have to get the data out from the database and will speed up the processing of this analysis.
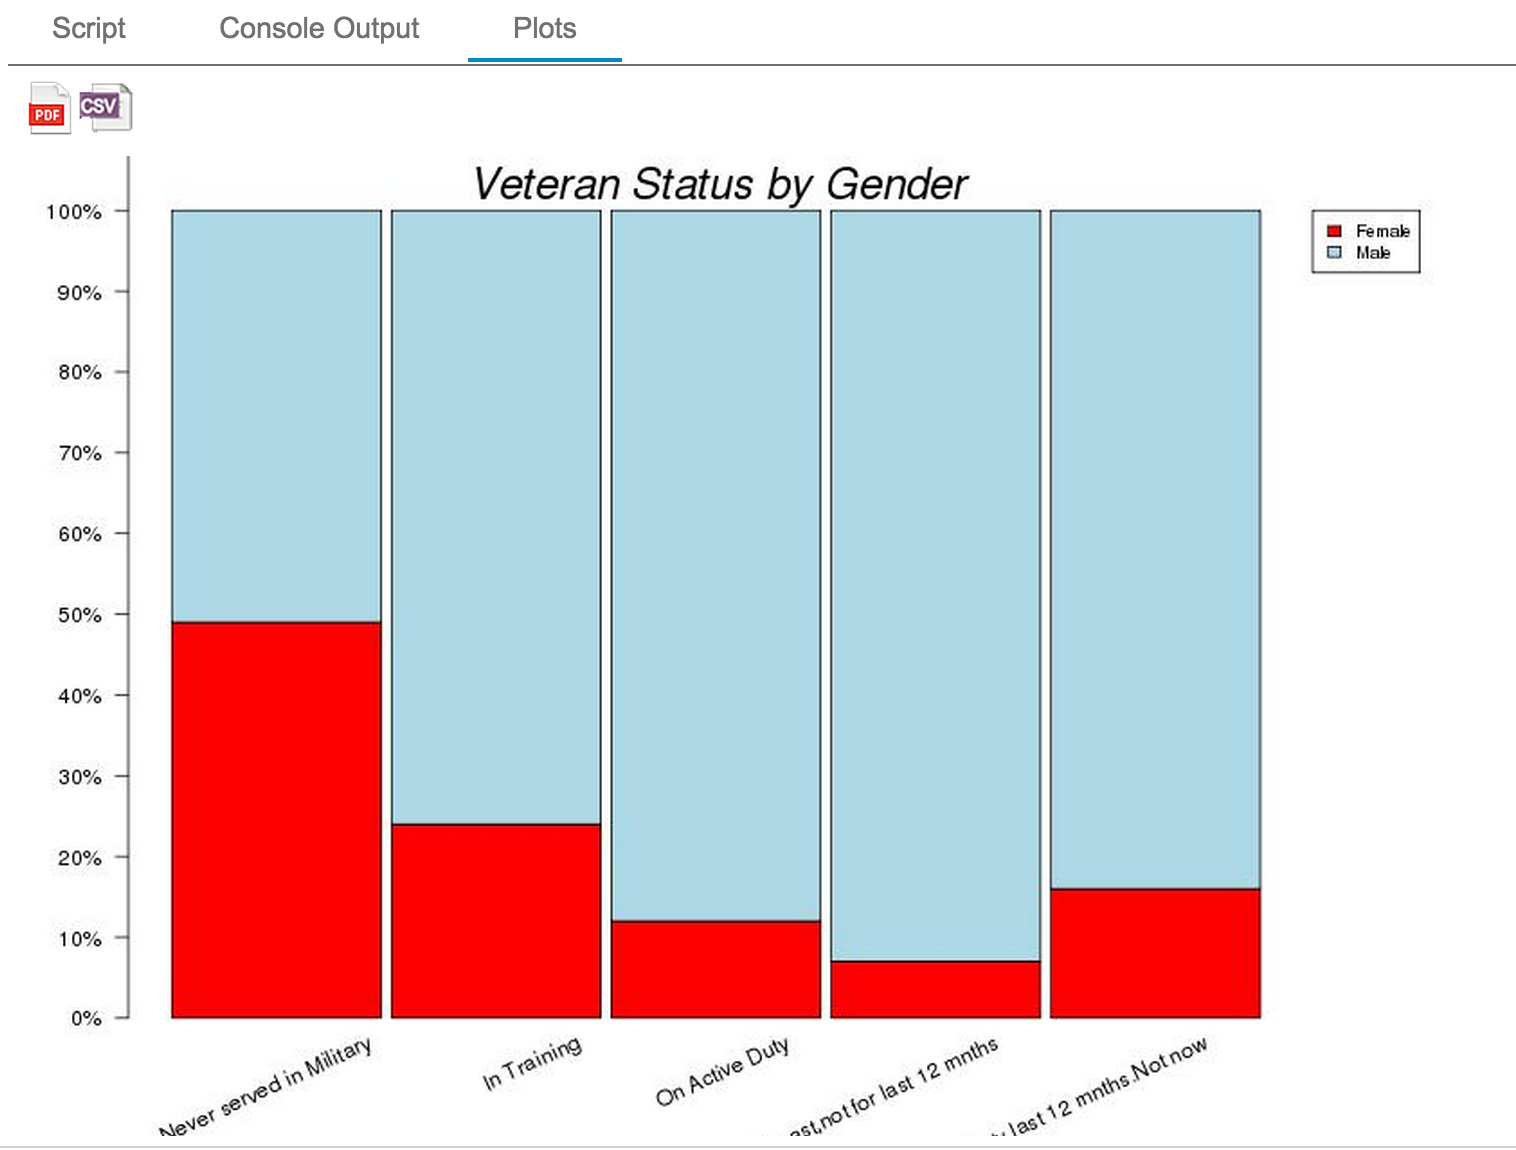
With this, we can build our own R scripts to get a nice plot showing the insights that we just need from the data.
Easier with an example
These two features are my favourites, but imagine: how could you use them together?
One easy use case I always think of is the following: you build a Node.js application, running on Bluemix. Using Node.js different API’s (like Twitter) you store the JSON data coming from these API’s in a Cloudant database. Now that you have your information (like tweets for a particular topic) stored in a NoSQL, JSON database in Cloudant, you can use the Cloudant sync option in dashDB to synchronize this data to your datawarehouse. With this option, you will have all the data coming from your tweets in a relational datawarehouse, easier to query and visualize. At this point, just go and use the R capabilities of dashDB to build an R script that will generate a plot showing statistical data (countries, number of retweets) from the tweets you analized for a particular topic. What do you think?
DIY: Do it yourself
That’s enough talking for today. Stay tuned for a technical post in the near future about using dashDB. Now just go ahead and try this yourself to see how this may be useful for your situation!
Visit www.dashdb.com and start to see the potential of dashDB and if you have any question just feel free to leave a comment below!
You can also get more information from the following links:
Learn more about dashDB, data warehousing and analytics power at your fingertips in the cloud
dashDB is Here, and This Changes Everything for Data Warehousing on the Cloud
Introducing Data Warehousing and Analytics with Cloudant and dashDB
IBM dashDB is here! Keeping data warehouse infrastructure out of your way
Tweet
If you liked this post, you can share it with your followers or follow me on Twitter!